
The chart below shows the results of a survey about people’s coffee and tea buying and drinking habits in five Australian cities. Summarise the information by selecting and reporting the main features and make comparisons where relevant.
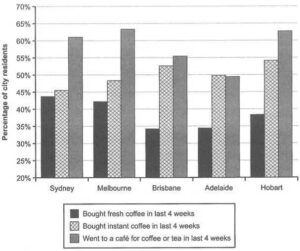
The bar chart illustrates the rate of buyers and drinkers of coffee and tea in five Australian cities in the last month.
Overall, more than half of the population in every city except Adelaide visited cafés for coffee or tea, though purchasing instant coffee was more popular as compared to fresh coffee.
Considering the people in Sydney and Melbourne, 64% of city residents in Melbourne went to cafes for tea or coffee which was the highest among all other cities, while in Sydney, it was just above 60%. Similarly, the number of customers who preferred instant coffee was slightly higher in Melbourne than that in Sydney, at 48%. The rate of purchase of fresh coffee in both cities noticed nearly the same which was around 43%.
In Brisbane, Adelaide and Hobart, 50% to 53% of people bought instant coffee, which was about 15% more than the proportion of people who drank fresh coffee. Regarding cafe visits for tea or coffee, an identical percentage of Melbourne was noticed in Hobart which was followed by Brisbane and Adelaide with 53% and 49% respectively.
Word count : 181