The chart below shows the results of a survey conducted by a university library to find out the opinions of full-time and part-time students about its services.
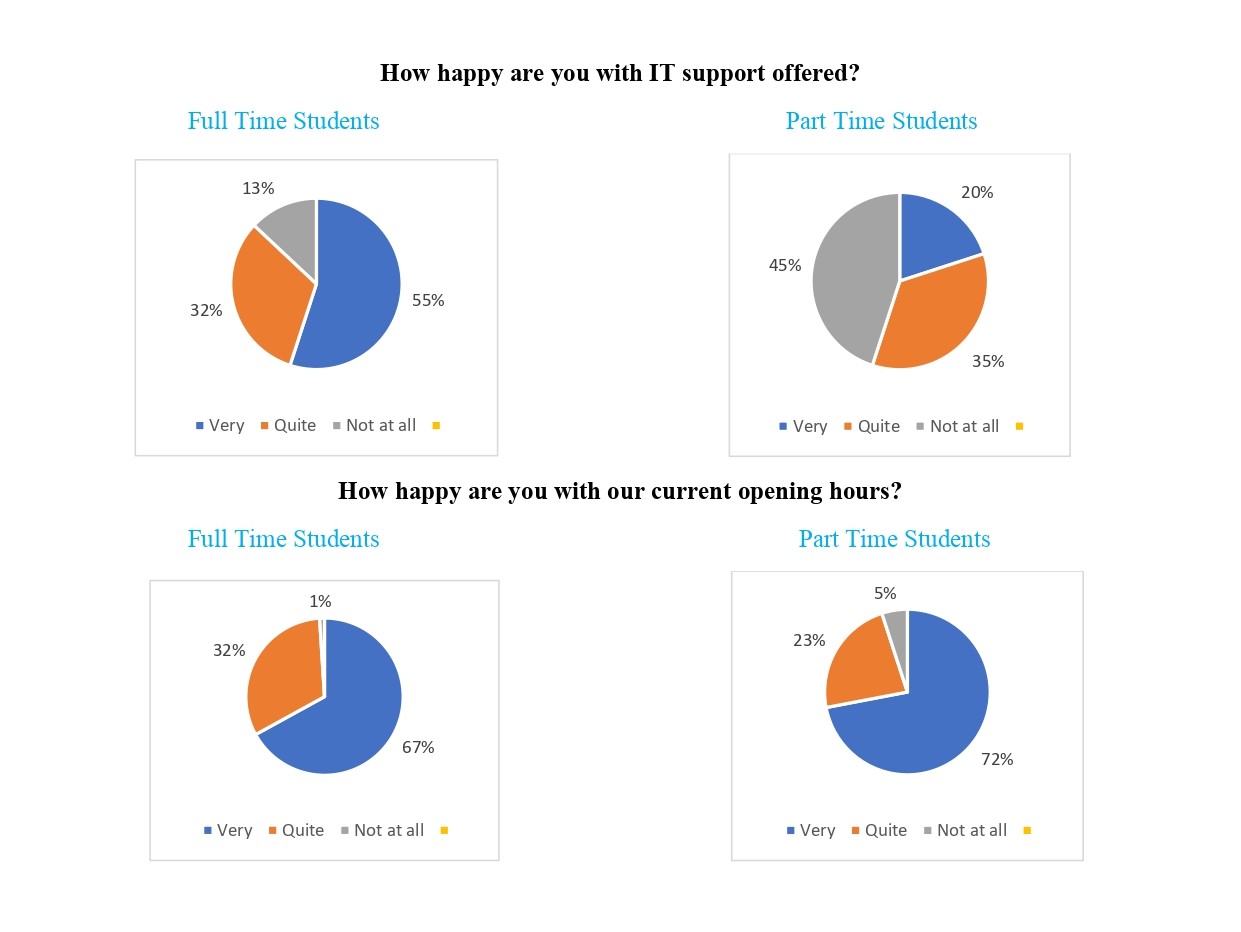
The pie charts compare the perspectives of full-time and part-time students regarding their university services, including IT Support and library opening hours.
Overall, full-time students tend to be more satisfied with the two services than their part-time counterparts. Meanwhile, students gave positive feedback about the library opening hours collectively.
As per the chart, it can be seen that more than half of full-time students were wholly pleased with the IT whereas only one-fifth of the part-time scholars were extremely satisfied. It was followed by the proportion of quite happy students in both groups, at around 33%. However, more than two-fifths of the part-time learners were disappointed with the service while only a small fraction of 13% of full-time students was dissatisfied.
In terms of opening hours, the majority of the full-time and part-time students were delighted. The former accounted for 67% while the latter made up 72%. There were just a few part-time students who stated that they were quite happy with the service, at 23%, compared with 32%of part-time ones. Finally, only a minority of students thought that they were not at all gratified, just 5% or less.
It is striking to note that only part-time students reported least satisfaction from the IT services whereas the library working hours was very happy for all students.