The chart below shows waste collection by a recycling centre from 2011 to 2015.
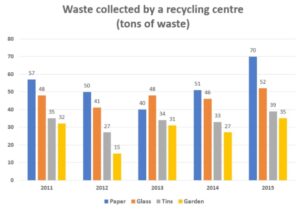
The graph depicts the amount of garbage gathered by a recycling facility over a five-year period from 2011. Tonnes are used to measure units.
Overall, the amount of waste collected for each type generally followed the same patterns and just slightly varied in the given years. Additionally, while garden waste was the least collected sort of recyclable waste, waste paper was the most.
Considering the paper waste, it accounted for the highest amount of garbage in the years except 2013. Although the quantity of waste paper collected showed a decreasing trend until 2013 starting from 57 tonnes to 40 tonnes, then it later spiked to 70 tonnes by 2015.
On the other hand, the glass waste fluctuated between 46-52 tonnes throughout the period whereas the least collection recorded in 2012 was 41 tonnes. A similar trend was noticed in the case of garden waste and tins which noticed fluctuations around 33-36 tonnes; however, later declined dramatically in the same year ;2012 to 15 and 27 tonnes respectively.
Words : 167