
The chart below shows what engineering graduates from a London university did after their undergraduate degree course. The table shows the salaries of the engineers in work after five years.
Summarise the information by selecting and reporting the main features and make comparisons where relevant.
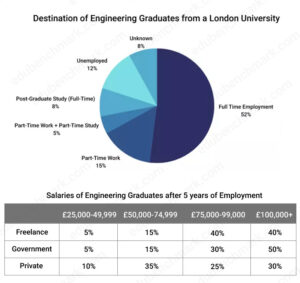
The given pie chart gives information regarding {career path of engineering ….) how London Engineering university students engaged in just after their graduation while table details how much they were paid after 5 years of work.
Overall, most of the engineering students preferred to work full time whereas very few were unemployed. Average salaries of freelance consultants and government employers were comparatively higher than private employers.
From the pie chart, it is seen that 52% of graduates were employed full time (it is clear that graduates who began full time work accounted for just over half (52%) while those in part time employment figured less than a fifth (15%). There was only 3% difference between full time learners of post-graduation and those who pursued part time work and study together in which the former rated 8%. 12% of students could not find a job after their studies while 8% of candidates did not mention what they did.
Looking at (focusing on) the table, the highest earners, of more than £100,000 were employed in freelance and government positions which were 40% and 50% respectively. However, in private sector this figure was less than one third of the total candidates. The least salary range of (£25000-£49,999) was limited to only 5% of workers in freelance and government field. In private sector, the highest rate of workers (35%) earned moderate salary which ranged in between £50,000 to £74,999.