
The pie charts below show the percentage of water used for different purposes in six areas of the world. Summarise the information by selecting and reporting the main features, and make comparisons where relevant.
Percentage of water used for different purposes in six areas of the world
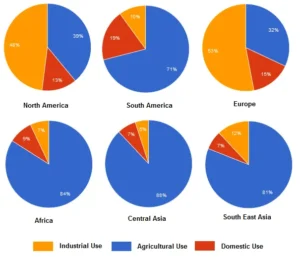
The given pie charts compare the utilization of water for agricultural, industrial and domestic needs.
Overall, it is clear from the pie charts that water was mainly utilized for agricultural purposes than other needs except in North America and Europe.
Strikingly, allocation of water for agriculture was dominant in Africa, Central Asia, South East Asia and South America, among which Central Asia used the highest amount of water (88%). Meanwhile, water consumed for domestic purposes in Central Asian and South East Asian households were similar at 7%. Nearly one-fifth of the water was taken for domestic purposes in South America whereas in Africa, it was around half of that of South America. It is evident that water utilized for the industrial sector was the least in South America, Africa and Central Asia, which was 10%, 7% and 5% respectively. In contrast, water usage in South East Asia was the second least, which was 12%.
Considering North America and Europe, the highest demand for water was in the industrial sector, which accounted for around half of the total consumption. Interestingly, a significant rate of water was also allocated for cultivation purposes. While nearly one-third of the total was utilized by Europeans, it was 39% by North American agricultural sector. However, residential needs constituted less than a fifth of total water consumption.