The pie charts show the electricity generated in Germany and France from all sources and renewables in the year 2009. Summarise the information by selecting and reporting the main features and make comparisons where relevant.
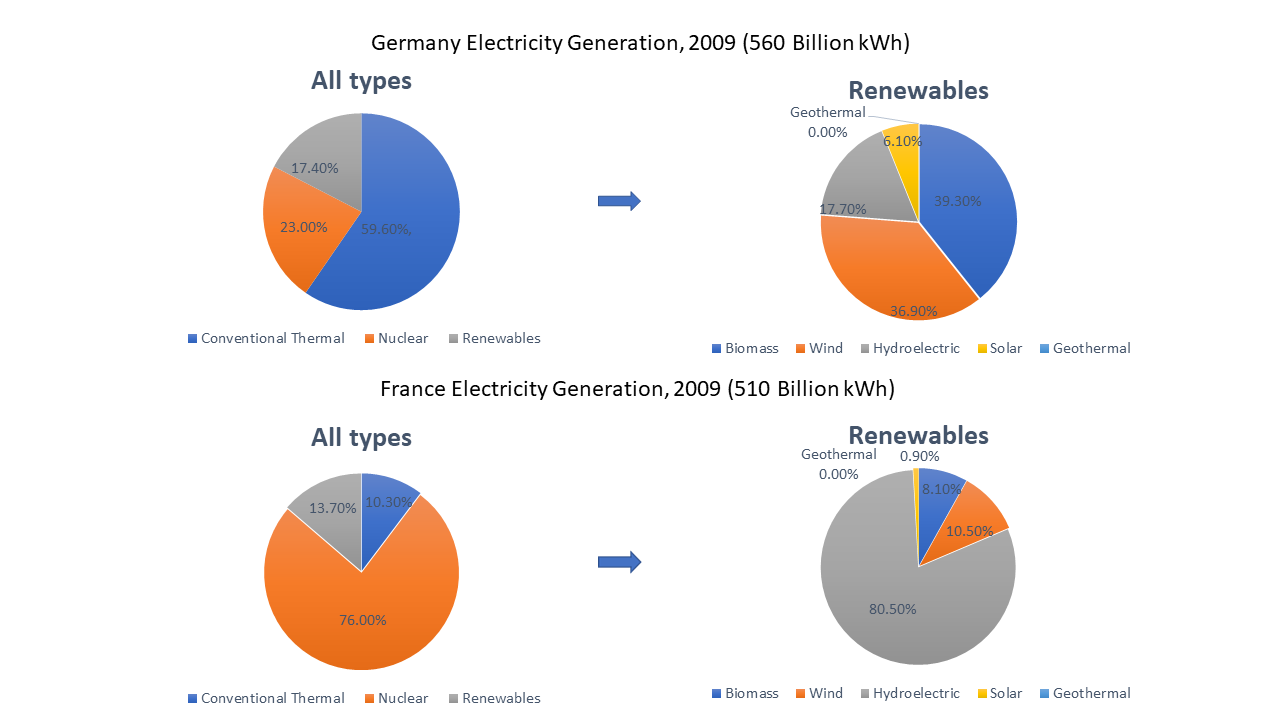
The pie charts compare the electricity generation of Germany and France in 2009. It is measured in billions of kWh.
Overall, it can be seen that Germany produced electricity from the conventional thermal resources whereas nuclear energy was the main power source in France.
Among all the types, conventional thermal accounted for more than half of the electric power produced in Germany while in France it contributed merely 10% of total electricity. In contrast, France relied mainly on nuclear materials, which constituted over three-quarter of the output.
Considering renewables, both countries used similar amount to generate electricity which was about 15%. In Germany, most of the renewables consisted of wind and biomass which resulted in production of 75% of total electricity whereas hydroelectric power and solar collectively generated only 23%. On the contrary, hydroelectric supplies made up 80% of renewable electricity in France while wind & biomass produced the remaining 20%. However, solar was hardly used resource in France.
In general, Germany recorded electricity generation of 560 billion kWh which was higher than that of France by 50 billion kWh. No any country used geothermal energy.