#12 Task 1 – Waste Recycling (Bar Chart)
The chart below shows waste collection by a recycling centre from 2011 to 2015. The graph depicts the amount of garbage gathered by a recycling facility over a five-year period from 2011. Tonnes are used to measure units. Overall, the amount of waste collected for each type generally followed the same patterns and just slightly […]
#11 Task 1 – Giving Up Smoking (Table)
The tables below show people’s reasons for giving up smoking, and when they intent to give up. Summarise the information by selecting and reporting the main features and make comparisons where relevant. Write at least 150 words. The two tables give information about why people decide to quit smoking and when they plan to do […]
#10 Task 1 – Coffee and Tea (Bar Chart)
The chart below shows the results of a survey about people’s coffee and tea buying and drinking habits in five Australian cities. Summarise the information by selecting and reporting the main features and make comparisons where relevant. The bar chart illustrates the rate of buyers and drinkers of coffee and tea in five Australian cities […]
Essay 27 – Choice of Having Fewer Children (Mixed Type)

Many people today, especially in the developed world, are choosing to have fewer children, or none at all. Why is this happening and do you think it is a good trend? Nowadays, in advanced countries, couples decide to have one or no child due to several reasons. However, I think it is a constructive step […]
Essay 26 – Effect of Technology On Rich And Poor (Discuss Both Sides)
Some believe that advances in technology are increasing the gap between rich and poor while others think the opposite is happening. Discuss both sides and give your own opinion. Although there is an argument that improvement in technology has reduced the economic disparities among people, I think that technological growth has widened the differences between […]
#9 Task 1 – Nuclear Energy from Uranium Oxide (Process)

The diagram below shows how uranium oxide is converted and enriched for the production of nuclear energy. Summarise the information by selecting and reporting the main features and make comparisons where relevant. The diagram illustrates the process of generating nuclear energy from uranium oxide. Overall, the nuclear fuel generation consists of several steps starting from […]
#8 Task 1 – Leisure and Household Activities (Mixed Type)
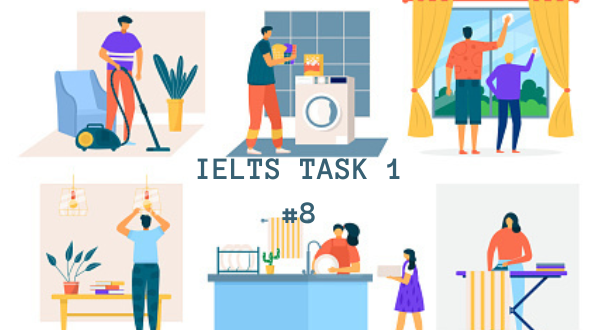
The table and chart show the time spent as leisure and household activities in 2008. Summarise the information by selecting and reporting the main features and make comparisons where relevant. Leisure Activities (average minute per day) Men Women TV, video, radio 137 118 Reading 18 19 Sport 15 11 The table and bar chart compare […]
Essay 25 – Expensive Weddings (Positive or Negative Development)
Weddings are getting bigger and more expensive. What is the reason for this? Is it a positive or negative development? Although there are individual justifications for conducting weddings exorbitantly, I think it is an adverse development since it does not contribute any benefits. To begin with, one of the major reasons why people conduct luxurious […]
Essay 24 – Truth or Lie (Agree or Disagree)

Some people think that telling the truth is not always essential. It is necessary to tell lies sometimes. To what extent do you agree or disagree? Being honest is always a good quality that many people suggest following. However, I think that telling lie on certain occasions is advisable if it benefits the person or […]
#7 Task 1 – Carbon Emissions (Line Graph)
The graph below shows average carbon dioxide (CO2) emissions per person in the United Kingdom, Sweden, Italy and Portugal between 1967 and 2007. Summarize the information by selecting and reporting the main features and make comparisons where relevant. The line graph depicts the average carbon dioxide emissions of each person in four different countries over […]